

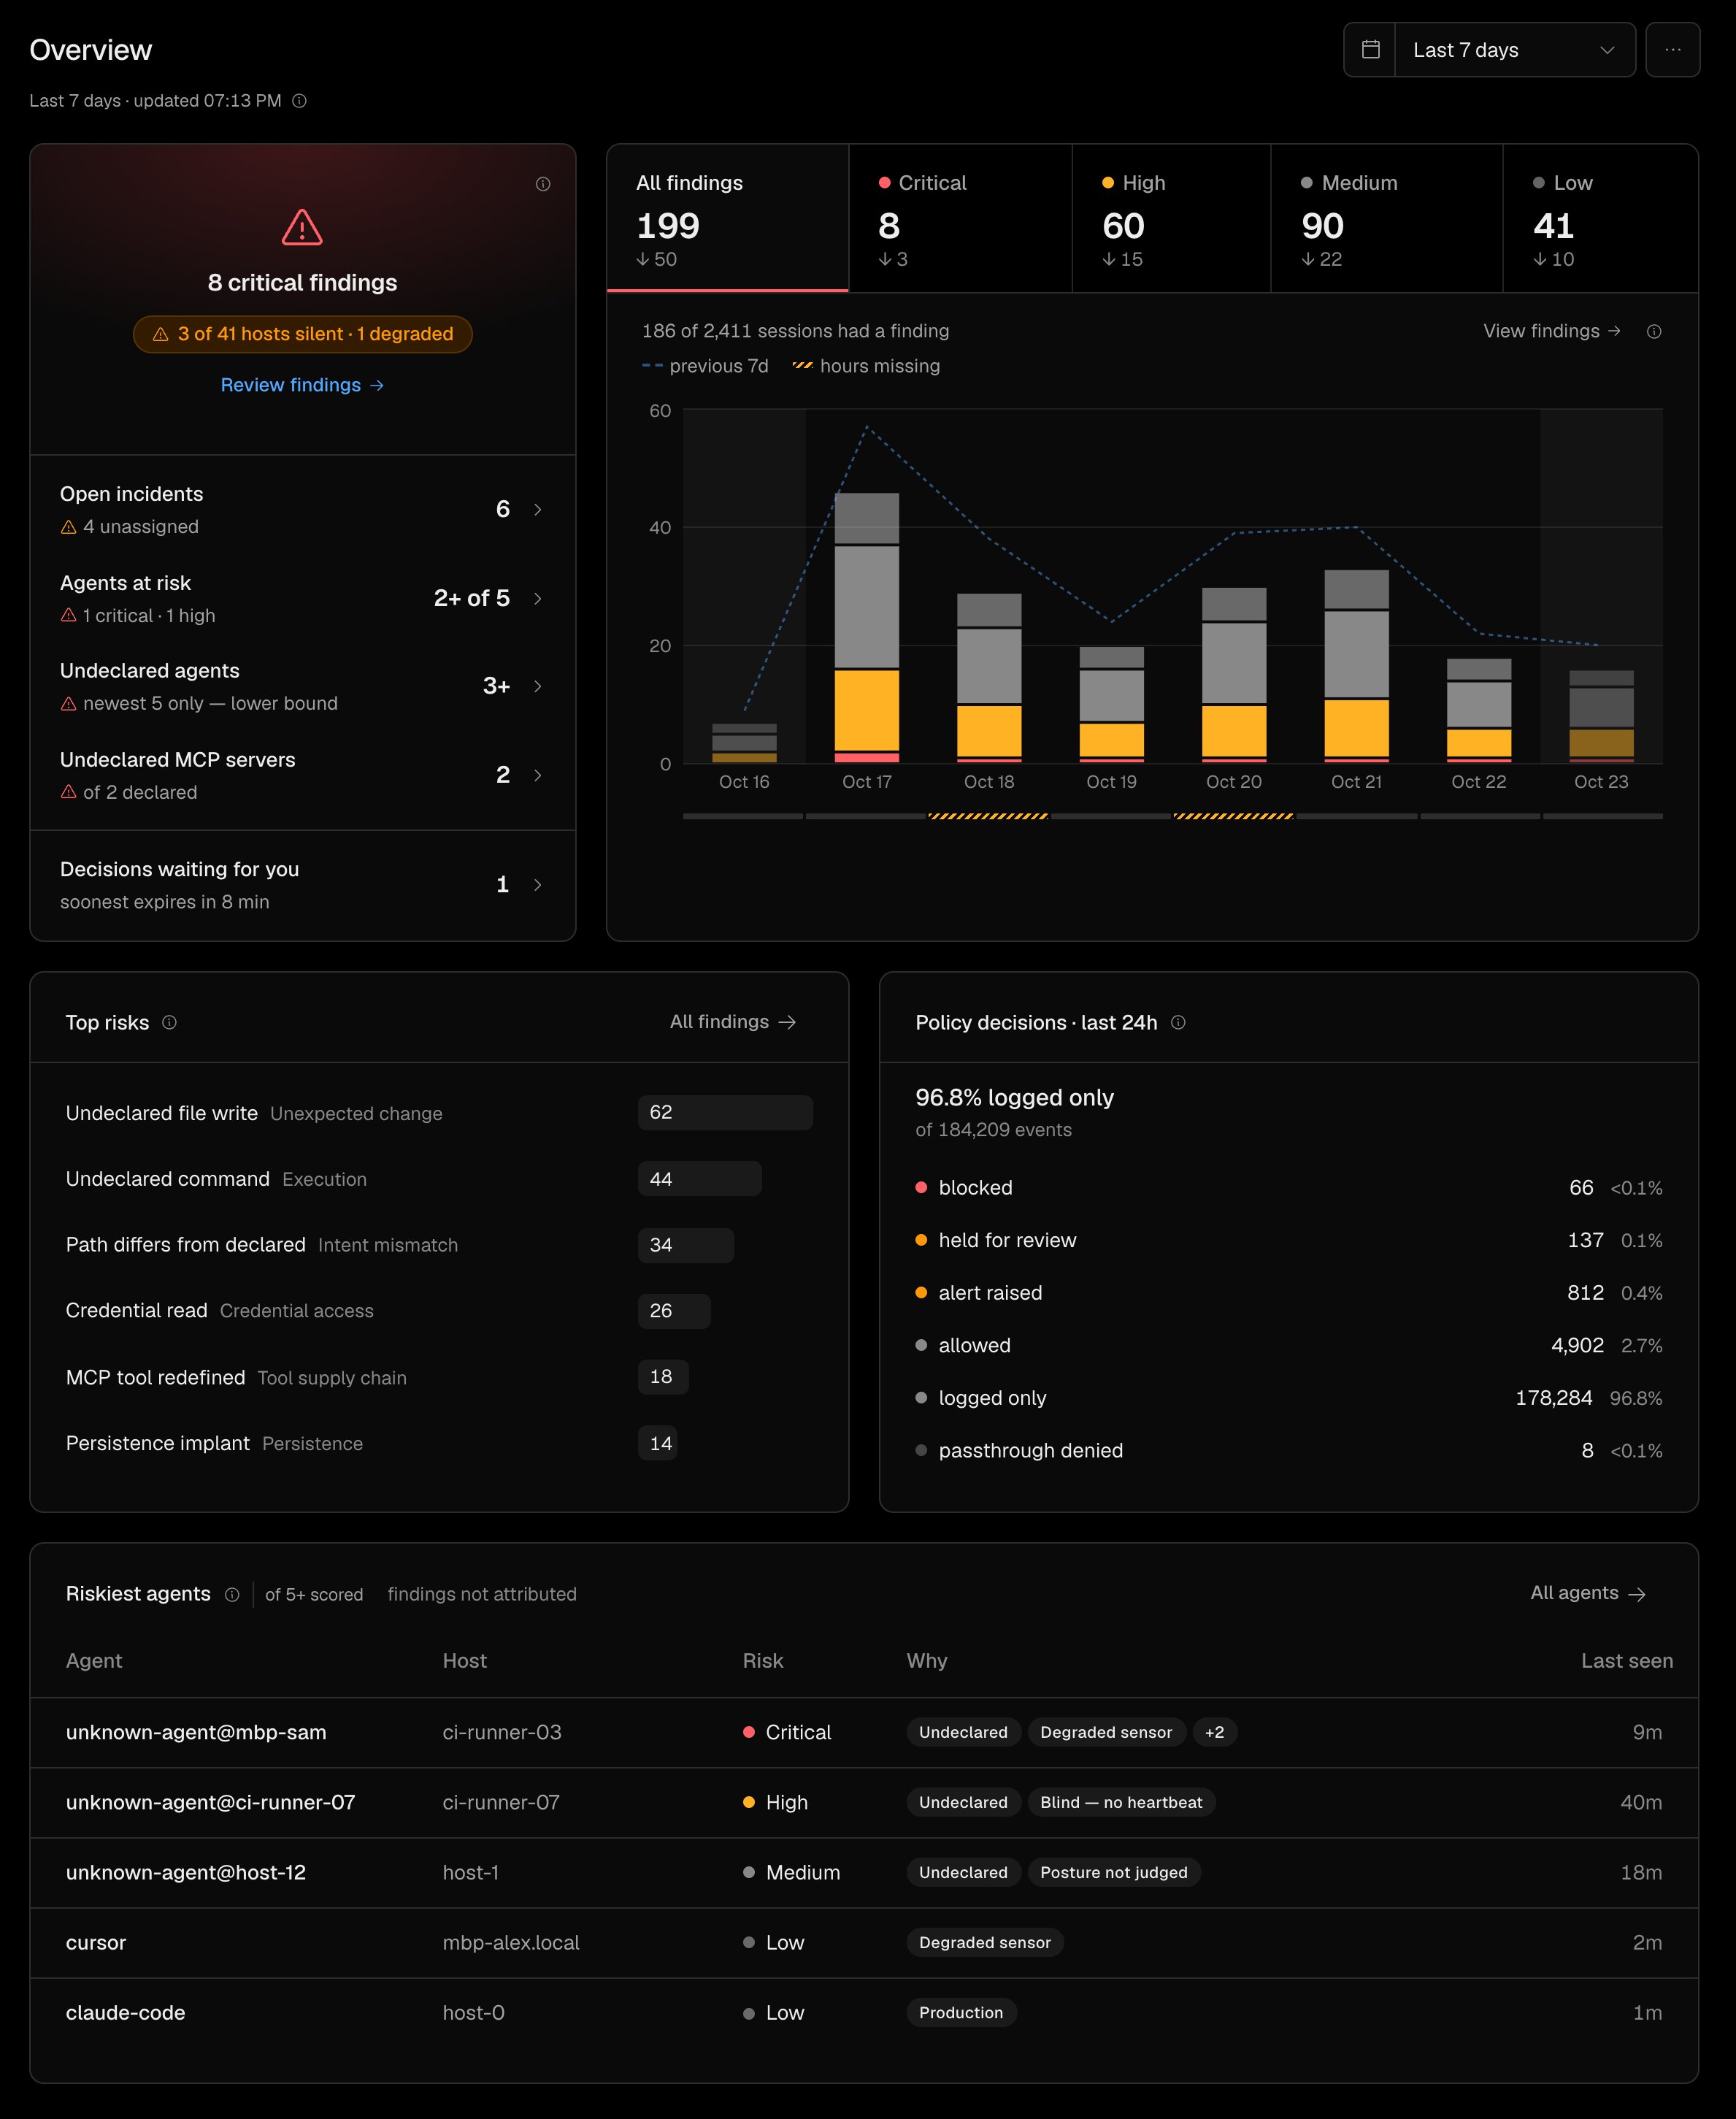
The scope line
Under the heading, a line such as “Last 7 days · updated 10:42” tells you the window every number below covers and when it was last refreshed. The default is the last 7 days. Presets run from 6 hours to 30 days; a custom range can cover up to 30 days within the last 30. Counts are kept per whole hour in UTC, so both ends of a range round down to the hour.1. Status: is the data complete?
The Status card leads with a verdict (“No high-risk findings”, “3 high-severity findings”, “2 critical findings”) and, beside it, a Coverage pill. Read the pill before the verdict.- “all 12 hosts reporting” means every enrolled machine sent telemetry in the window. The verdict stands.
- “Coverage is incomplete” means some machines did not report. A quiet verdict over incomplete coverage is a gap, not an all-clear. Open the pill to see hosts reporting and hours with telemetry, then check Data Sources.
Below the verdict, four rows link onward: Open incidents, Agents at risk, Undeclared agents and Undeclared MCP servers. Each has a review action. Under them, Decisions waiting for you counts the approval requests waiting on you and when the soonest expires; it opens Approvals.
2. Findings over time
A chart of findings by severity (tabs All findings, Critical, High, Medium, Low), with the previous window drawn as a dashed line so you can see whether this window is better or worse. View findings opens the Divergence page filtered to the same window.3. Top risks
Findings ranked by the risk they represent, named plainly: “Credential read, then egress”, “Persistence implant”, “Undeclared command”, “MCP tool redefined”. Each bar shows its category (Credential access, Exfiltration, Persistence, Execution, Unexpected change, Intent mismatch, Approval bypass, Tool supply chain). “No findings in the window.” is a result; “Ranking unavailable on this API” is not.4. Policy decisions · last 24h
What rules decided in the last 24 hours, always over a fixed 24-hour window regardless of the picker. On a fleet in shadow mode this reads as recorded decisions; nothing was interrupted. See Shadow enforcement.5. Riskiest agents
A table of agents with columns Agent, Host, Risk, Why and Last seen. The Why chips are the reason an agent ranks where it does:
Notes under the table (“findings not attributed”, “inputs missing”) say when the ranking rests on partial inputs. All agents opens the Agents page.
What to do when a number is red
- Critical or high findings: Investigate a finding.
- Agents at risk or undeclared agents: open Agents, filter Unclassified, and look at Identification on the agent’s page.
- Coverage incomplete, blind or degraded hosts: open Data Sources, filter Silent or Degraded, and follow Verify and troubleshoot.
- Open incidents: open Incidents and work the board from Open.